
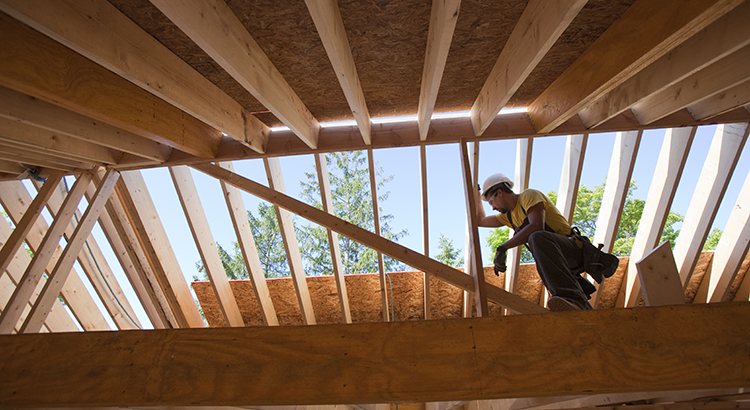
Where Will You Go If You Sell? Newly Built Homes Might Be the Answer.
Where Will You Go If You Sell? Newly Built Homes Might Be the Answer. Do you want to sell your house, but hesitate because you’re worried you won’t be able to find your next home in today’s market? You're not alone, but there’s some good news that may ease your worries. New home construction is up a

Lending Standards Are Not Like They Were Leading Up to the Crash
Lending Standards Are Not Like They Were Leading Up to the Crash You might be worried we’re heading for a housing crash, but there are many reasons why this housing market isn’t like the one we saw in 2008. One of which is how lending standards are different today. Here’s a look at the data to help

Why Homeownership Wins in the Long Run
Why Homeownership Wins in the Long Run Today’s higher mortgage rates, inflationary pressures, and concerns about a potential recession have some people questioning: should I still buy a home this year? While it’s true this year has unique challenges for homebuyers, it’s important to think about the
Categories
- All Blogs (796)
- agent (180)
- baby boomers (184)
- best realtor (118)
- buy (188)
- buy a house (191)
- buyer myths (183)
- Buying Myths (184)
- demographics (185)
- Down payment (182)
- For Buyers (186)
- For Sellers (186)
- foreclosures (185)
- gen z (186)
- generation x (186)
- Holidays (183)
- homebuyers (193)
- homeownership (186)
- house maintenance (182)
- house preparation (182)
- housing market updates (184)
- infographics (183)
- Interest Rates (182)
- listing (184)
- Luxury Market (184)
- luxury real estate (183)
- millenials (187)
- mortgage (188)
- mortgages (181)
- pricing (182)
- purchase (189)
- real estate (117)
- realestateexperts (116)
- realtor (118)
- rent vs buy (182)
- Rent vs. Buy (180)
- schools (177)
- sell (185)
- sell a house (182)
- sellers (176)
- sellers market (176)
- selling myths (175)
Recent Posts


